Quant strategy overfitting intro
On 11 August 2024 - tagged evaluation, machine-learning
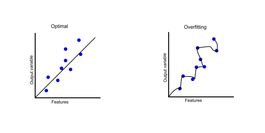
Overfitting is a common problem in machine learning and quant model fitting. It happens when the model is too complex and fits the training data too closely. This can lead to poor generalization and poor performance on new data.

In trading, overfitting means that your model or backtest will seem to perform great on historical data, or backtest, but perform poorly on live trading data. This can make you implement a poor trading strategy or allocate more capital to a model than you should. Both are costly mistakes.
When to be concerned #
Many people think that simple strategies with a few parameters cannot be overfitted. Or that overfitting is not a problem when you tune your parameters manually. However, this is not true and I have seen badly overfitted models containing three parameters tuned by hand.
For example, knowing the maximum x-day loss or its tail quantile can be used for a near-perfect 'buy-the-dip' strategy with a single 'overfit' parameter. You simply buy when the price gets close to this metric and realize great profits on historical data. However, in the future the x-day loss can be much lower, resulting in very few trades or much higher, resulting in losses.
How to detect #
Detecting overfitting is not easy. The basic idea is using an out-of-sample test set to evaluate the model. Then you compare the out-of-sample error (or another metric) to the in-sample error. If the out-of-sample error is significantly higher than the in-sample error, then you have overfitting.
However, once you run the overfitting detection a few times, perhaps when tuning hyper-parameters or when improving the strategy, you are in fact manually overfitting on your out-of-sample data. Inevitably, you will reach a decent performance on the out-of-sample data.
Rule of thumb: once you have used out-of-sample data a few times, you need another set of data for proper model validation. This means you should save a lot of 'unseen' data when choosing your training data set.
Pretty good way to detect overfitting is to use rolling cross-validation or its most common variant, k-fold cross-validation. In k-fold cross-validation, you split your data into k-folds. Then, you train your model on k-1 folds and test it on the remaining fold. If you model could benefit from temporal structure (knowledge of future data), you can use expanding window walk-forward validation instead.

How to not overfit #
There are several ways to prevent overfitting in the first place, that can be combined with overfitting detection. The basic advice is to always use the simplest possible model complexity. That can mean smaller neural network, less gradient boosting trees, or even a simple linear regression.
The complexity of the model can be further penalized by using regularization. Regularization is a technique that adds a penalty term to the loss function and penalizes the model for having too many parameters. This way, the model can automatically find the right balance between complexity and performance.
You can also remove some features that don't improve out-of-sample performance. For example if you have the current date in a time-series model, it could just remember when significant events happened in the past. Calendar date is obviously not a useful feature, but using day-of-week or day-of-month features might often make sense and can both improve performance or lead to overfitting.
Example: expanding window validation #
from sklearn.model_selection import TimeSeriesSplit

X = np.array([[1, 2], [3, 4], [1, 2], [3, 4], [1, 2], [3, 4]])
y = np.array([1, 2, 3, 4, 5, 6])
tscv = TimeSeriesSplit(n_splits=3)

for train, test in tscv.split(X):
   print("%s %s" % (train, test))
Results in train/test splits:
[0 1 2] [3]
[0 1 2 3] [4]
[0 1 2 3 4] [5]
Follow up articles in overfitting series #
New posts are announced on X/twitter @jan_skoda or @crypto_lake_com, so follow us!