Plotting cumulative orderbook in Python
On 10 August 2024 - tagged python
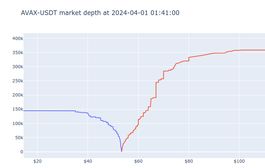
Here is a simple function for plotting cumulative orderbook in Python with Python and Plotly. The idea is easy to convert to other programming languages or plotting libraries such as Matplotlib.
To get started, you need prices and cumulative quantities prepared in lists or perhaps numpy arrays. This step depends on your data source. Then you can use the following function:
import plotly.express as px
import pandas as pd

def plot_order_book(
	bid_price, bid_cum_quantity, ask_price, ask_cum_quantity, title
):
	'''
	Plot order book shape (cumulative quantity curve)
	'''
	fig = px.line(
		x = pd.concat([bid_price, ask_price]),
		y = pd.concat([bid_cum_quantity, ask_cum_quantity]),
		color = ['blue'] * len(bid_price) + ['red'] * len(ask_price),
		title = title,
	)
	fig.update_layout(showlegend = False)
	fig.update_yaxes(
		title = None
	)
	fig.update_xaxes(
		tickformat = 'B',  # Dont use SI units like micro, nano.
		title = None,
    	tickprefix = '$',
	)
	return fig


plot_order_book(
	pd.Series(prices['bids']),
	pd.Series(cum_quantities['bids']),
	pd.Series(prices['asks']),
	pd.Series(cum_quantities['asks']),
	title = 'ABC-USDT market depth at time ...'
)
This generates plots like this with the ability to zoom in or pan around:

If you're using crypto-lake historical order book data, you can use the following complete code including getting and processing the data: https://colab.research.google.com/drive/1--iB9Jpxbr-DBBGjho2OdND_c_AEPMIa
New posts are announced on X/twitter @jan_skoda or @crypto_lake_com, so follow us!