Working with missing data in time-series processing
On 31 March 2025 - tagged python
Missing data cannot be avoided on crypto due to faulty exchanges and infrastructure. We can reduce the amount of missing data by having redundant infrastructure such as downloading streaming data from multiple server locations, but that can get expensive and complicated. Machine-learning models are also famous for being able to handle missing data and noise pretty well, but sometimes they need help in feature-engineering. And feature-engineering can be sensitive to missing data unless we pay attention to it.
Let's assume tabular format of data which is commonly used by timeseries and Pandas. Missing data can demonstrate here in two general ways:
1. We don't even explicitly know that the data is missing, we just don't have some rows perhaps for a few minutes. This has to be detected by some kind of statistical/anomaly analysis. For instance we could compute 1% quantile of time difference between two consecutive rows and if we see a longer gap, we can assume that there are missing data in between.
2. The missing data are represented by NaN values in some rows or columns. This often happens when we aggregate the first case to a fixed time window, eg.
convert trades to 1-minute volume series.
Window aggregations #
In timeseries feature preprocessing we usually create features as time aggregation, typical feature is some rolling or expanding window statistics. When data are missing in the window, the statistic is corrupted. Therefore we want to fill such statistics with NaN values marking missing data when significant portion of input data for the statistics/feature is missing. This can be done for example using min_periods parameter of the rolling window or expanding window aggregation:
import pandas as pd
import numpy as np

df = pd.DataFrame({
    'date': pd.date_range('2025-01-01', '2025-01-10'),
    'price': [1, 2, np.nan, 4, 5, 6, 7, 8, 9, 10],
})

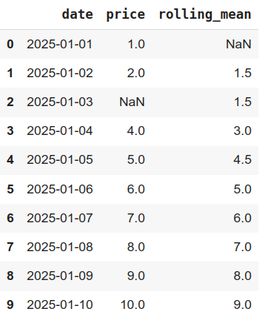
df['rolling_mean'] = df['price'].rolling(window=3, min_periods=2).mean()

Note that the first row was also correctly market with NaN value, because we did not have enough data to compute the statistic at the beginning of the timeseries. The missing price on third row was silently ignored as we still had 2 out of 3 data points to compute the statistic. We recommend to do this especially for long-term aggregations, so that for example if you lose 1 minute every three days, your weekly volume average won't be reset to NaN frequently.
Note that some statistics can be using future data, for example labels/targets for machine-learning models. In such cases, you can still use the same approach, just in the opposite direction.
Usage in machine-learning #
When you want to use such features in ML training, you can simply drop the rows with any NaN value in features or target/label. You should do it ideally on the whole dataframe using subset parameter of dropna function, not separately for features and targets as this might shift rows order and introduce lookahead bias.
feature_columns = ['some', 'feature', 'columns']
correct_data = df.dropna(subset = feature_columns + ['target'])
X = correct_data[feature_columns]
y = correct_data['target']
model.fit(X, y)
Conclusion #
Missing data are a frequent problem in data science. We can however efficiently minimize their impact on results by handling them properly. With the powerful Pandas library, we can easily use its NaN handling machinery to propagate information about missing data through our feature processing pipeline and avoid both using and loosing too much (partially) corrupted data.
New posts are announced on X/twitter @jan_skoda or @crypto_lake_com, so follow us!